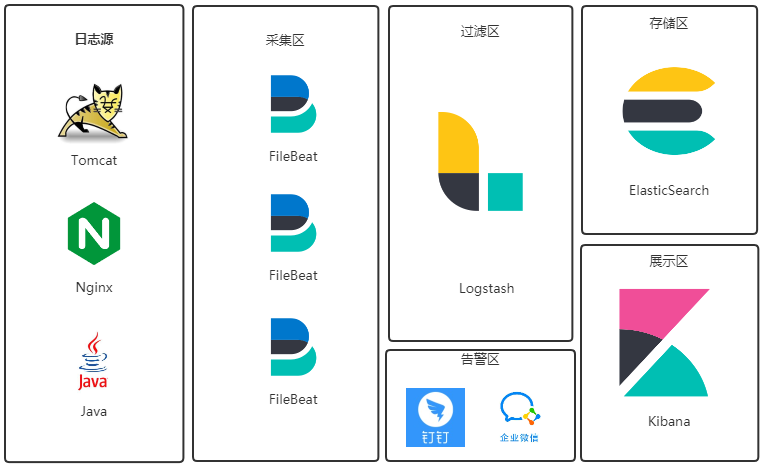
系统选型 Elastic 公司有一套免费开源的日志采集系统(ELK),所以我选择拿来即用. 日志流: 日志文件→FileBeat→Logstash→ElasticSearch→Kibana
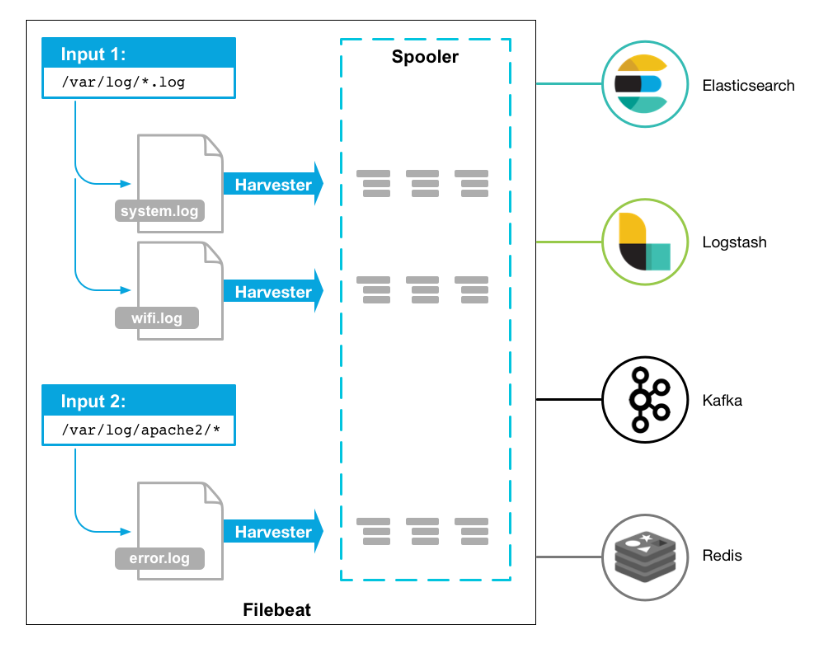
Filebeat Filebeat是一款轻量级日志采集器,可用于转发和汇总日志与文件.Filebeat内置有多种模块(Nginx、MySQL、Redis、Elasticsearch、Logstash等),可针对常见格式的日志大大简化收集、解析和可视化过程,只需一条命令即可.
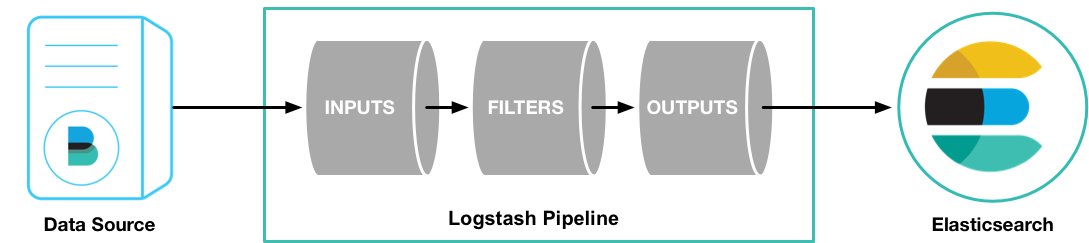
Logstash Logstash是一个分布式日志收集框架,开发语言是JRuby,经常与ElasticSearch,Kibana配合使用组成著名的ELK技术栈,所谓ELK就是ElasticSearch、Logstash、Kibana这三个组件.
ElasticSearch Elasticsearch 是一个分布式、可扩展、实时的搜索与数据分析引擎.它提供了一个分布式多用户能力的全文搜索引擎,基于RESTful web接口.
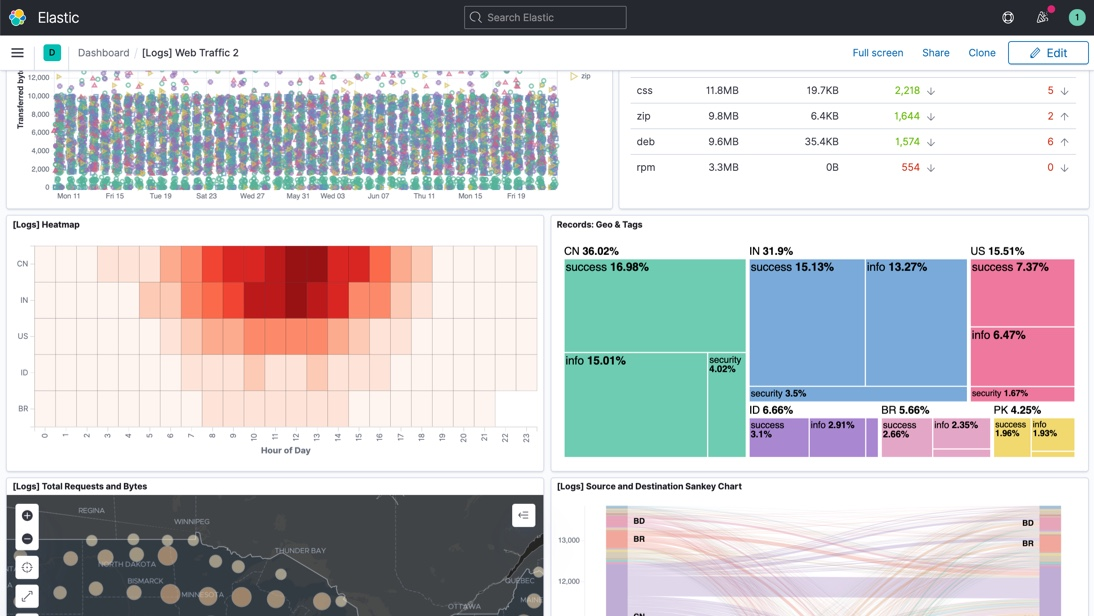
Kibana Kibana 是一个免费且开放的用户界面,能够让您对 Elasticsearch 数据进行可视化.您可以进行各种操作,从跟踪查询负载,到理解请求如何流经您的整个应用,都能轻松完成.
系统准备 系统设置 1 2 3 4 5 6 7 8 9 10 11 12 13 14 15 16 17 systemctl stop firewalld.service systemctl disable firewalld.service vi /etc/sysctl.conf vm.max_map_count=262144 sysctl -p vim /etc/security/limits.conf * soft nofile 65536 * hard nofile 131072 * soft nproc 2048 * hard nproc 4096
jdk安装
1 2 3 4 5 6 7 8 9 10 11 12 13 14 15 16 17 18 cd /optwget https://builds.openlogic.com/downloadJDK/openlogic-openjdk/11.0.8%2B10/openlogic-openjdk-11.0.8%2B10-linux-x64.tar.gz tar -zxvf openlogic-openjdk-11.0.8+10-linux-x64.tar.gz mv openlogic-openjdk-11.0.8+10-linux-x64/ jdk/sed -i.ori '$a export ES_JAVA_HOME=/opt/jdk\nexport PATH=$ES_JAVA_HOME/bin:$ES_JAVA_HOME/jre/bin:$PATH\nexport CLASSPATH=.:$ES_JAVA_HOME/lib:$ES_JAVA_HOME/jre/lib:$ES_JAVA_HOME/lib/tools.jar' /etc/profile source /etc/profilejava -version openjdk version "11.0.8" 2020-07-14 OpenJDK Runtime Environment OpenLogic-OpenJDK (build 11.0.8+0-adhoc.centos.jdk11u) OpenJDK 64-Bit Server VM OpenLogic-OpenJDK (build 11.0.8+0-adhoc.centos.jdk11u, mixed mode)
Elasticsearch部署 1 2 3 4 5 6 7 8 9 10 11 12 13 14 15 16 17 18 19 20 21 22 23 24 25 26 27 28 29 30 31 32 cd /optwget https://artifacts.elastic.co/downloads/elasticsearch/elasticsearch-7.14.1-linux-x86_64.tar.gz tar -zxvf elasticsearch-7.14.1-linux-x86_64.tar.gz cp -r elasticsearch-7.14.1/ /usr/local/elasticsearchln -s /usr/local/elasticsearch/ elasticsearchvim /usr/local/elasticsearch/config/elasticsearch.yml cluster.name: my-application node.name: node-1 path.data: /usr/local/elasticsearch/data/ path.logs: /usr/local/elasticsearch/logs/ network.host: 0.0.0.0 http.port: 9200 cluster.initial_master_nodes: ["node-1" ] http.cors.enabled: true http.cors.allow-origin: "*"
es不能以root用户身份运行,所以要创建新的用户组和用户名称
1 2 3 4 5 6 7 groupadd elsearch useradd elsearch -g elsearch -p elasticsearch chown -R elsearch:elsearch /usr/local/elasticsearch
启动es
1 2 3 4 su elsearch /usr/local/elasticsearch/bin/elasticsearch -d
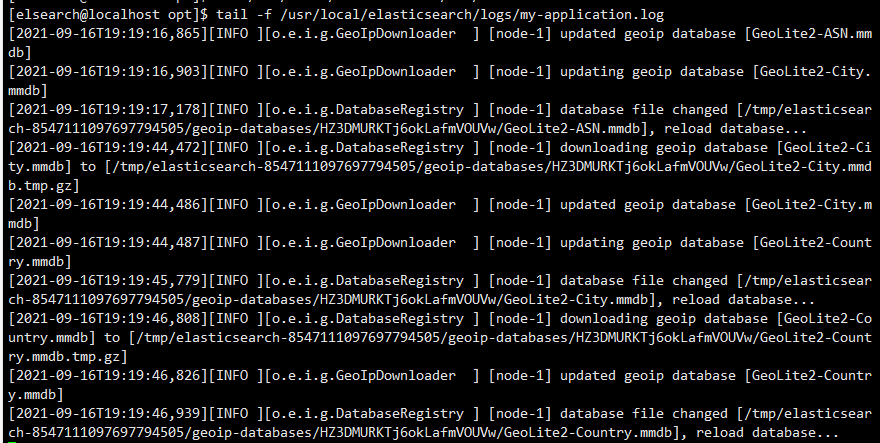
查看启动日志可执行命令tail -f /usr/local/elasticsearch/logs/my-application.log
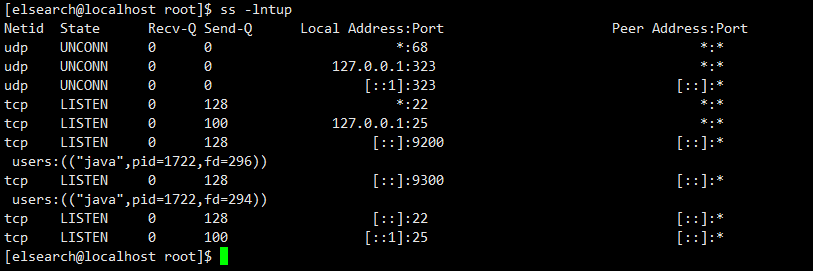
通过ss -lntup查看端口号已经启动
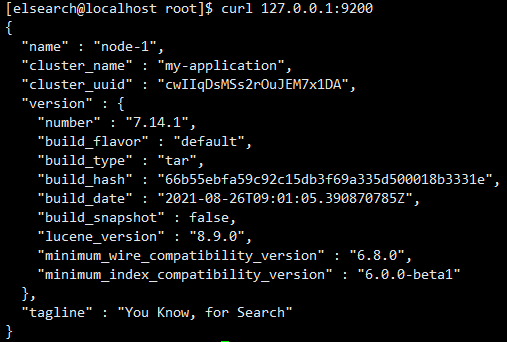
执行curl命令检查服务是否正常响应:curl 127.0.0.1:9200,收到响应如下:
至此,ElasticSerach服务启动成功
Kibana部署 1 2 3 4 5 6 7 8 9 10 11 12 13 14 15 16 17 18 19 20 21 22 23 24 25 26 27 28 29 30 31 32 33 34 35 36 cd /optwget https://artifacts.elastic.co/downloads/kibana/kibana-7.14.1-linux-x86_64.tar.gz tar -zxvf kibana-7.14.1-linux-x86_64.tar.gz cp -r kibana-7.14.1-linux-x86_64 /usr/local/kibanaln -s /usr/local/kibana/ kibanavim /usr/local/kibana/config/kibana.yml server.port: 80 server.host: "主机的IP地址" elasticsearch.hosts: ["http://xxx.xxx.xxx.xxx:9200" ] i18n.locale: "zh-CN" :wq chown -R elsearch:elsearch /usr/local/kibanasu elsearch /usr/local/kibana/bin/kibana nohup /usr/local/kibana/bin/kibana &
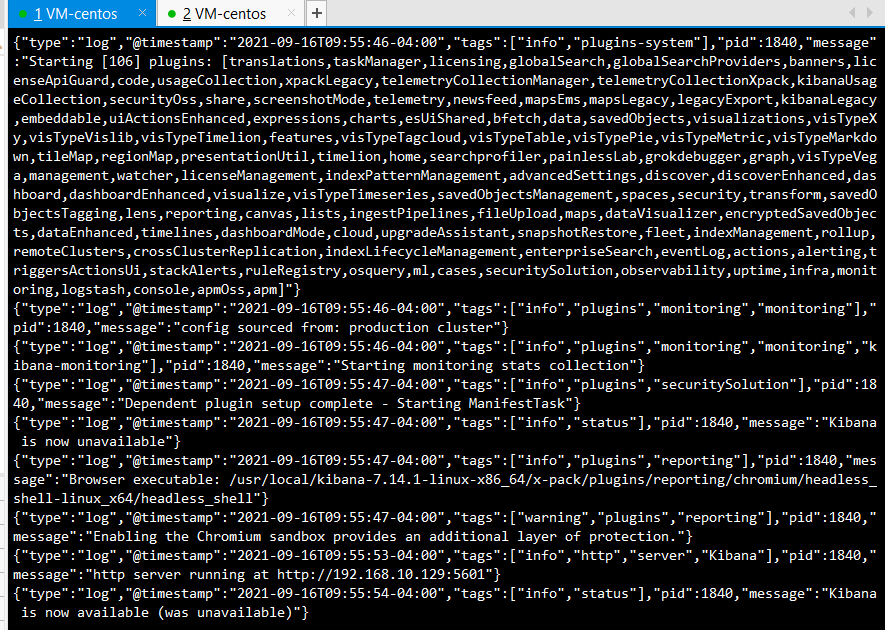
查看启动日志:tail -f /home/elsearch/nohup.out 以下信息表示启动成功:
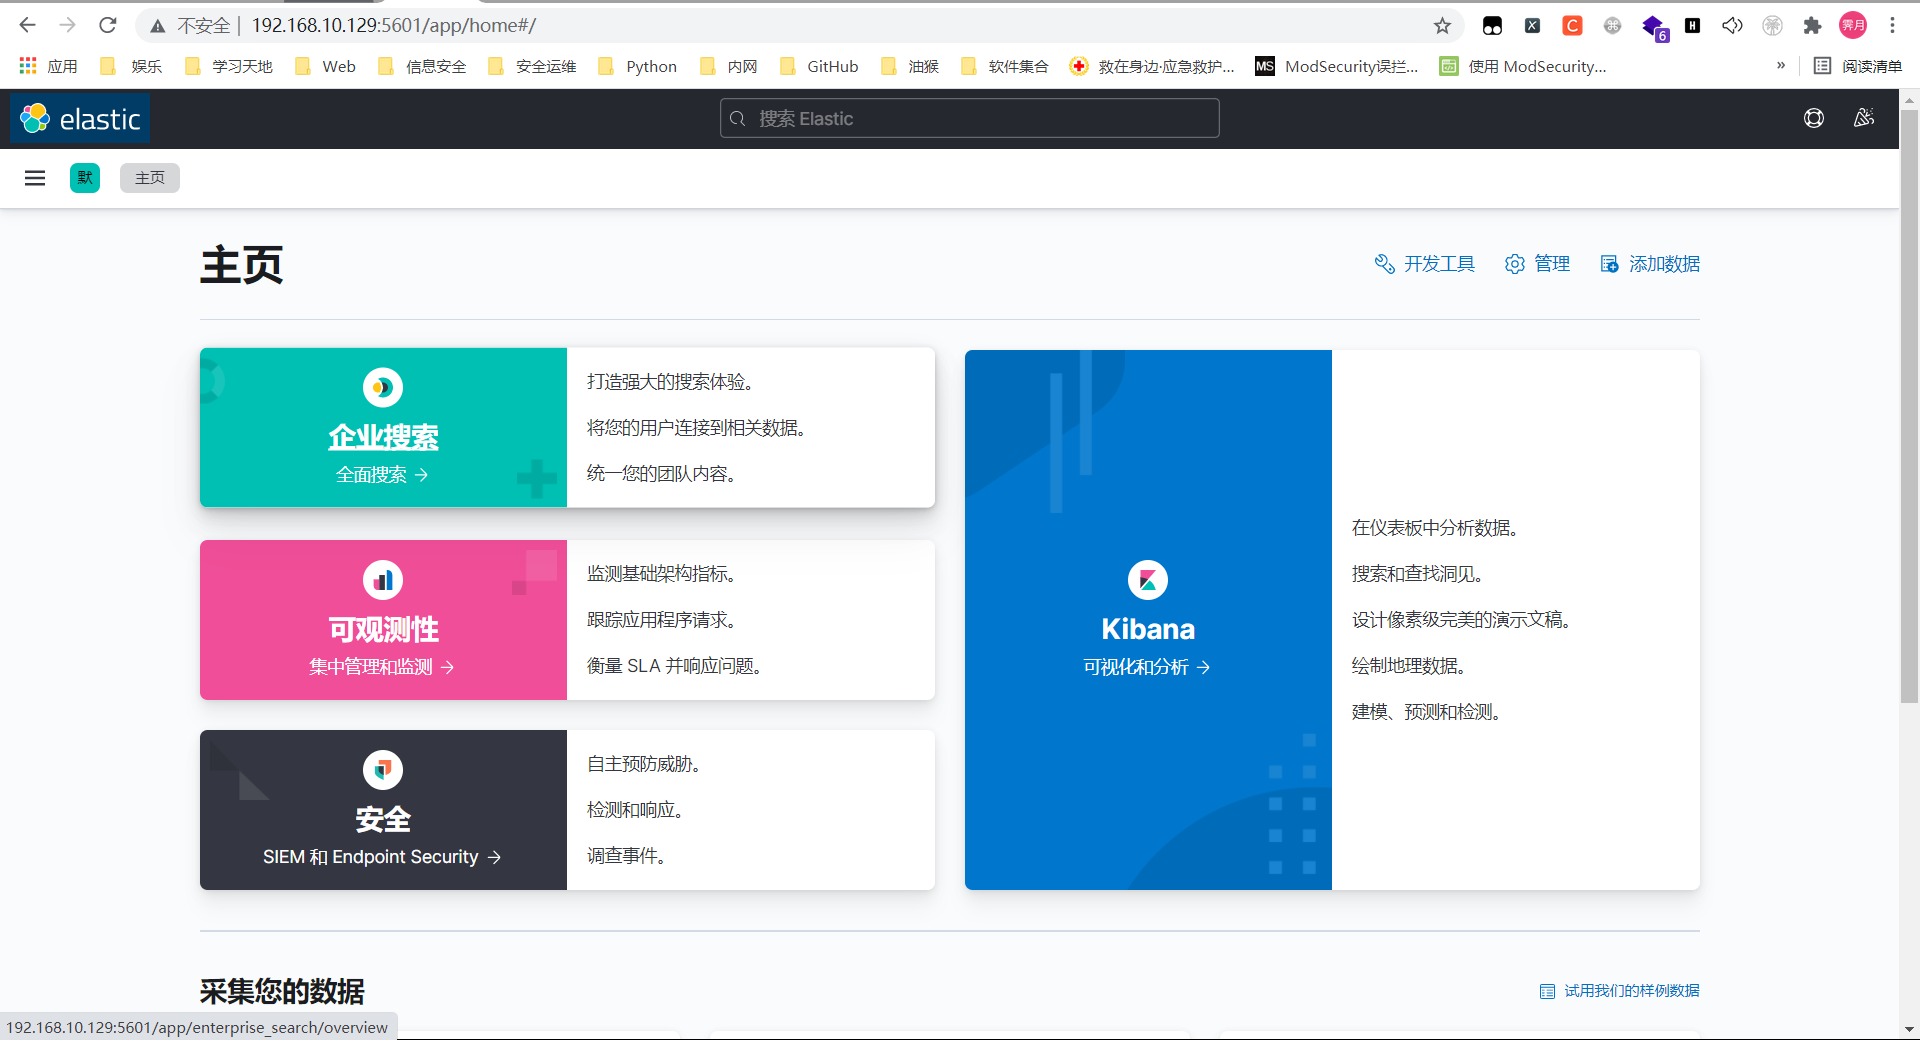
在浏览器访问http://主机IP:80;看到如下页面
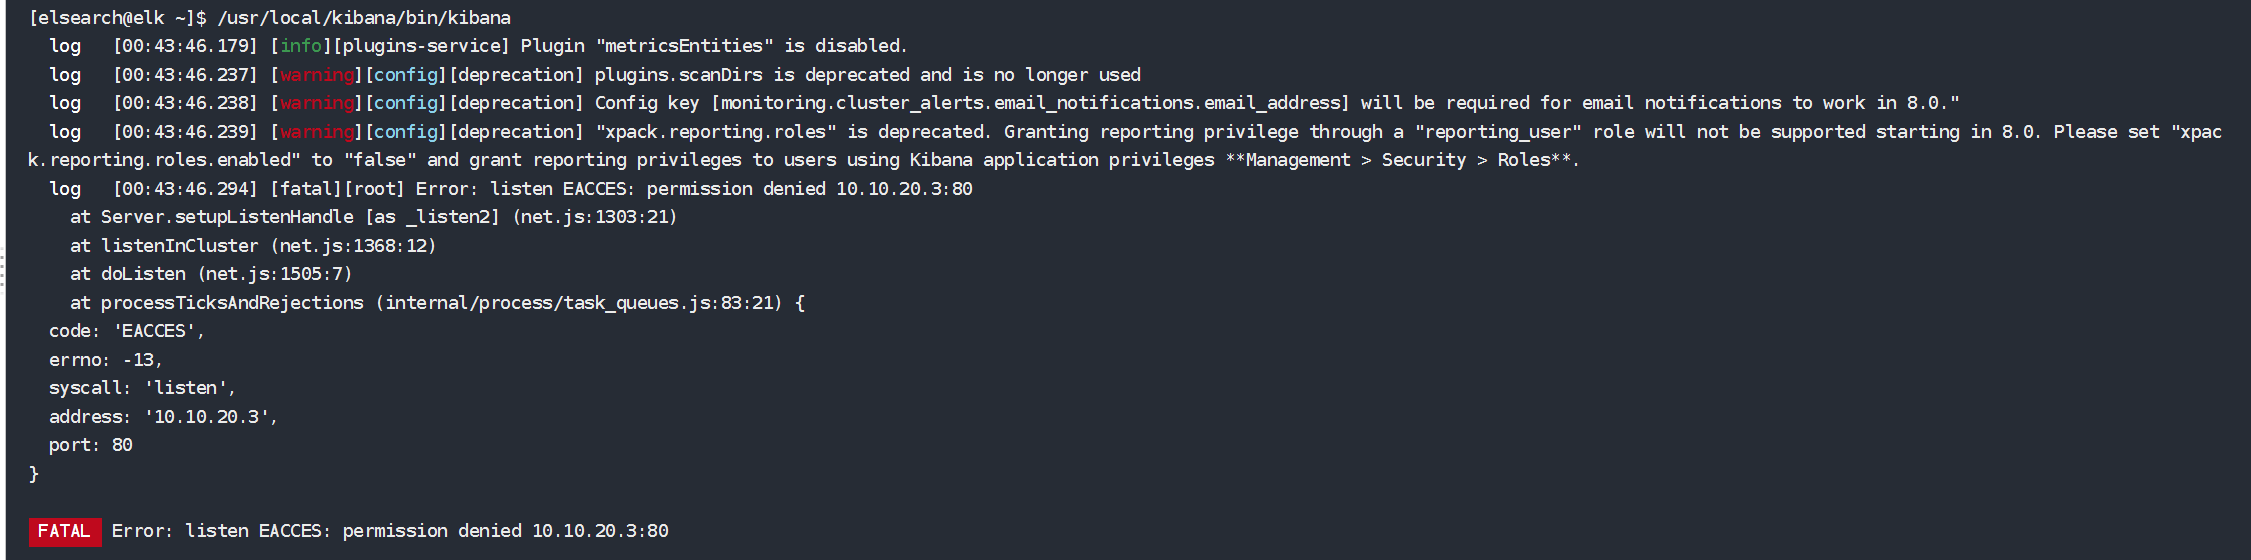
小技巧
linux对于非root权限用户不能使用1024以下的端口,为了能够绑定端口 80 或 443,我们需要为 kibana 的二进制文件设置一些新功能.这可以以 root 用户身份使用以下命令完成:
1
2
3
4
setcap cap_net_bind_service=+epi /usr/local/kibana/bin/kibanasetcap cap_net_bind_service=+epi /usr/local/kibana/bin/kibana-pluginsetcap cap_net_bind_service=+epi /usr/local/kibana/bin/kibana-keystoresetcap cap_net_bind_service=+epi /usr/local/kibana/node/bin/node
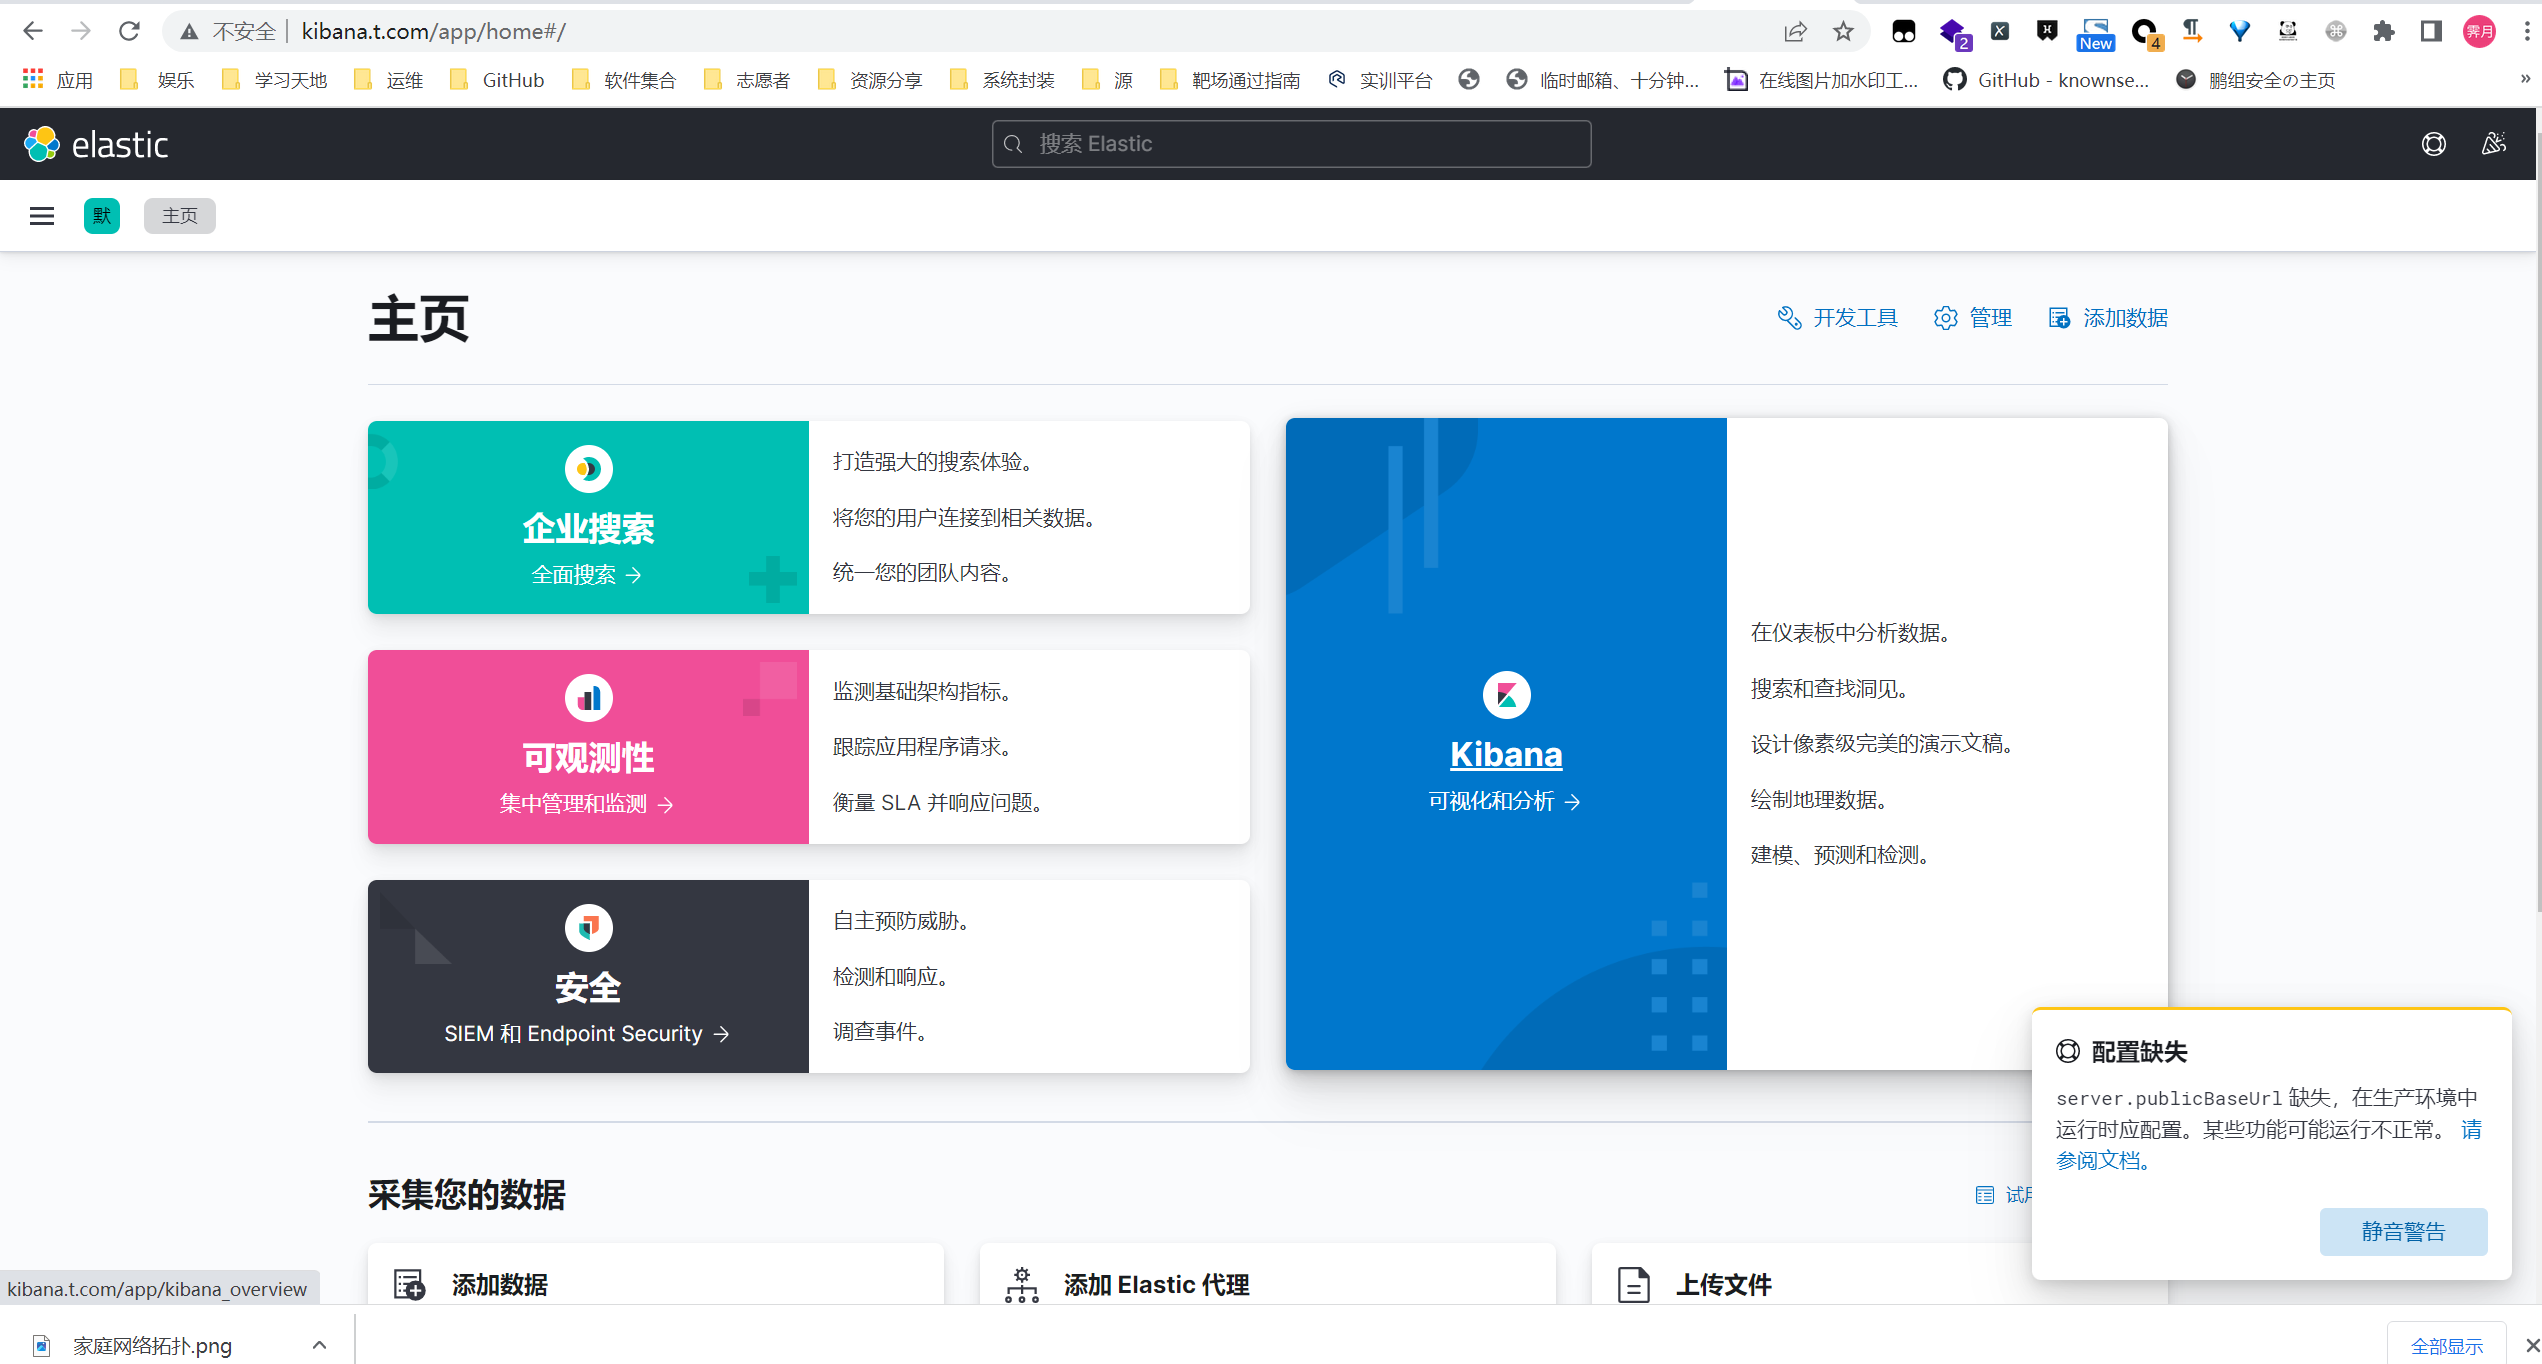
现在就可以了
Filebeat部署(日志机) 1 2 3 4 5 6 7 8 9 10 11 12 13 14 15 16 17 18 19 20 21 22 23 24 25 26 27 28 29 30 31 32 33 34 35 36 37 38 39 40 41 42 43 44 45 46 47 48 49 50 51 52 53 54 55 56 57 58 59 60 61 62 63 64 65 66 67 68 69 70 71 72 cd /opt wget https://artifacts.elastic.co/downloads/beats/filebeat/filebeat-7.14.1-linux-x86_64.tar.gz tar -zxvf filebeat-7.14.1-linux-x86_64.tar.gz mkdir /usr/local/elk cp -r filebeat-7.14.1-linux-x86_64 /usr/local/elk/filebeat vim /usr/local/elk/filebeat/filebeat.yml filebeat.inputs: - type: log enabled: true paths: - /usr/local/nginx/nginx/logs/access*.log fields: log_type: logbackjson output.logstash: hosts: ["localhost:5044" ] :wq nohup /usr/local/elk/filebeat/filebeat -e -c /usr/local/elk/filebeat/filebeat.yml -d "Publish" & > nohup.out ps -ef grep filebeat kill -9 pid
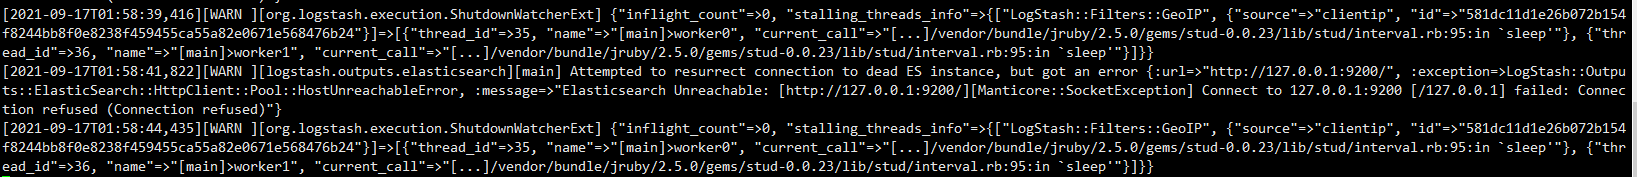
logstash部署(日志机) 1 2 3 4 5 6 7 8 9 10 11 12 13 14 15 16 17 18 19 20 21 22 23 24 25 26 27 28 29 30 31 32 33 34 35 36 37 38 39 40 wget https://artifacts.elastic.co/downloads/logstash/logstash-7.14.1-linux-x86_64.tar.gz tar -zxvf logstash-7.14.1-linux-x86_64.tar.gz mkdir /usr/local/elkcp -r logstash-7.14.1 /usr/local/elk/logstashvim /usr/local/elk/logstash/default.conf input { beats { port => "5044" } } filter { grok { match => { "message" => "%{COMBINEDAPACHELOG}" } } geoip { source => "clientip" } } output { elasticsearch { hosts => ["192.168.10.129:9200" ] index => "%{appname}-%{+YYYY.MM.dd}" } } nohup /usr/local/elk/logstash/bin/logstash -f /usr/local/elk/logstash/default.conf --config.reload.automatic &cp /usr/local/elk/logstash/logstash-7.14.1/jdk/lib/server/libjvm.so /usr/local/elk/logstash/jdk/lib/server/tail -f /usr/local/elk/logstash/logs/logstash-plain.log
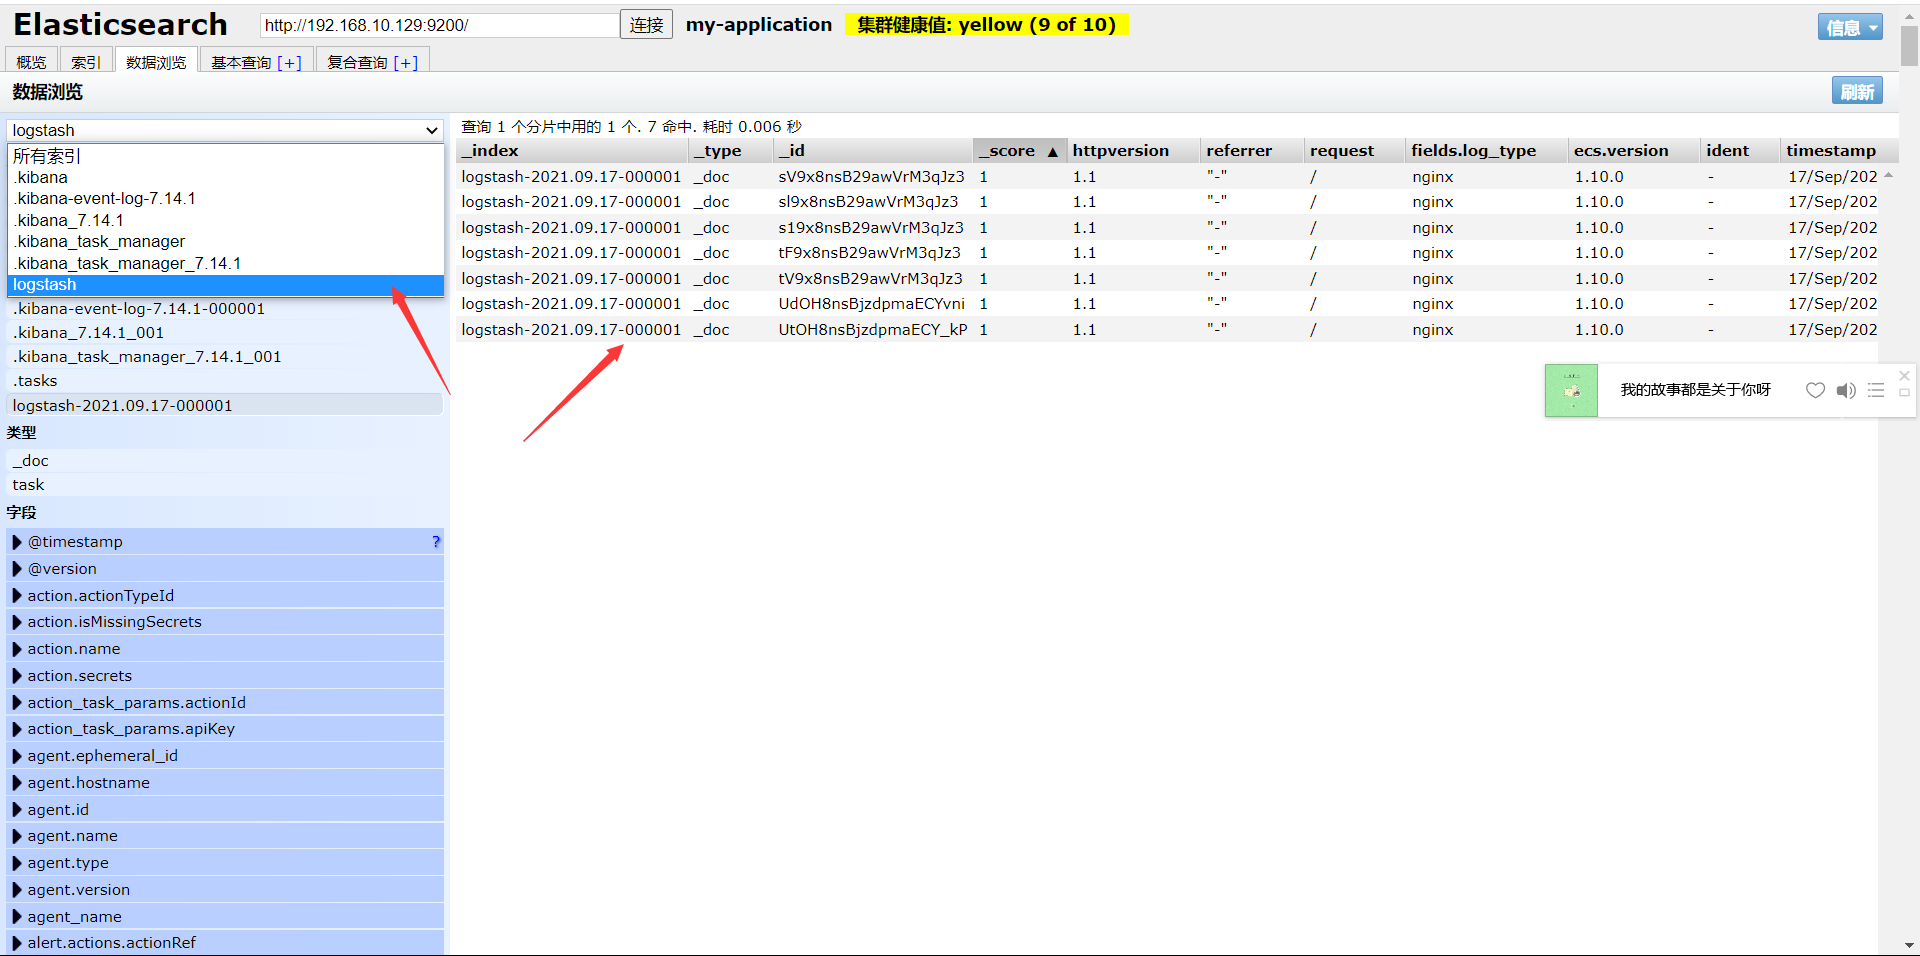
Kibana配置 Chrome扩展程序下载ElasticSearch Head,查看ElasticSearch是否有数据
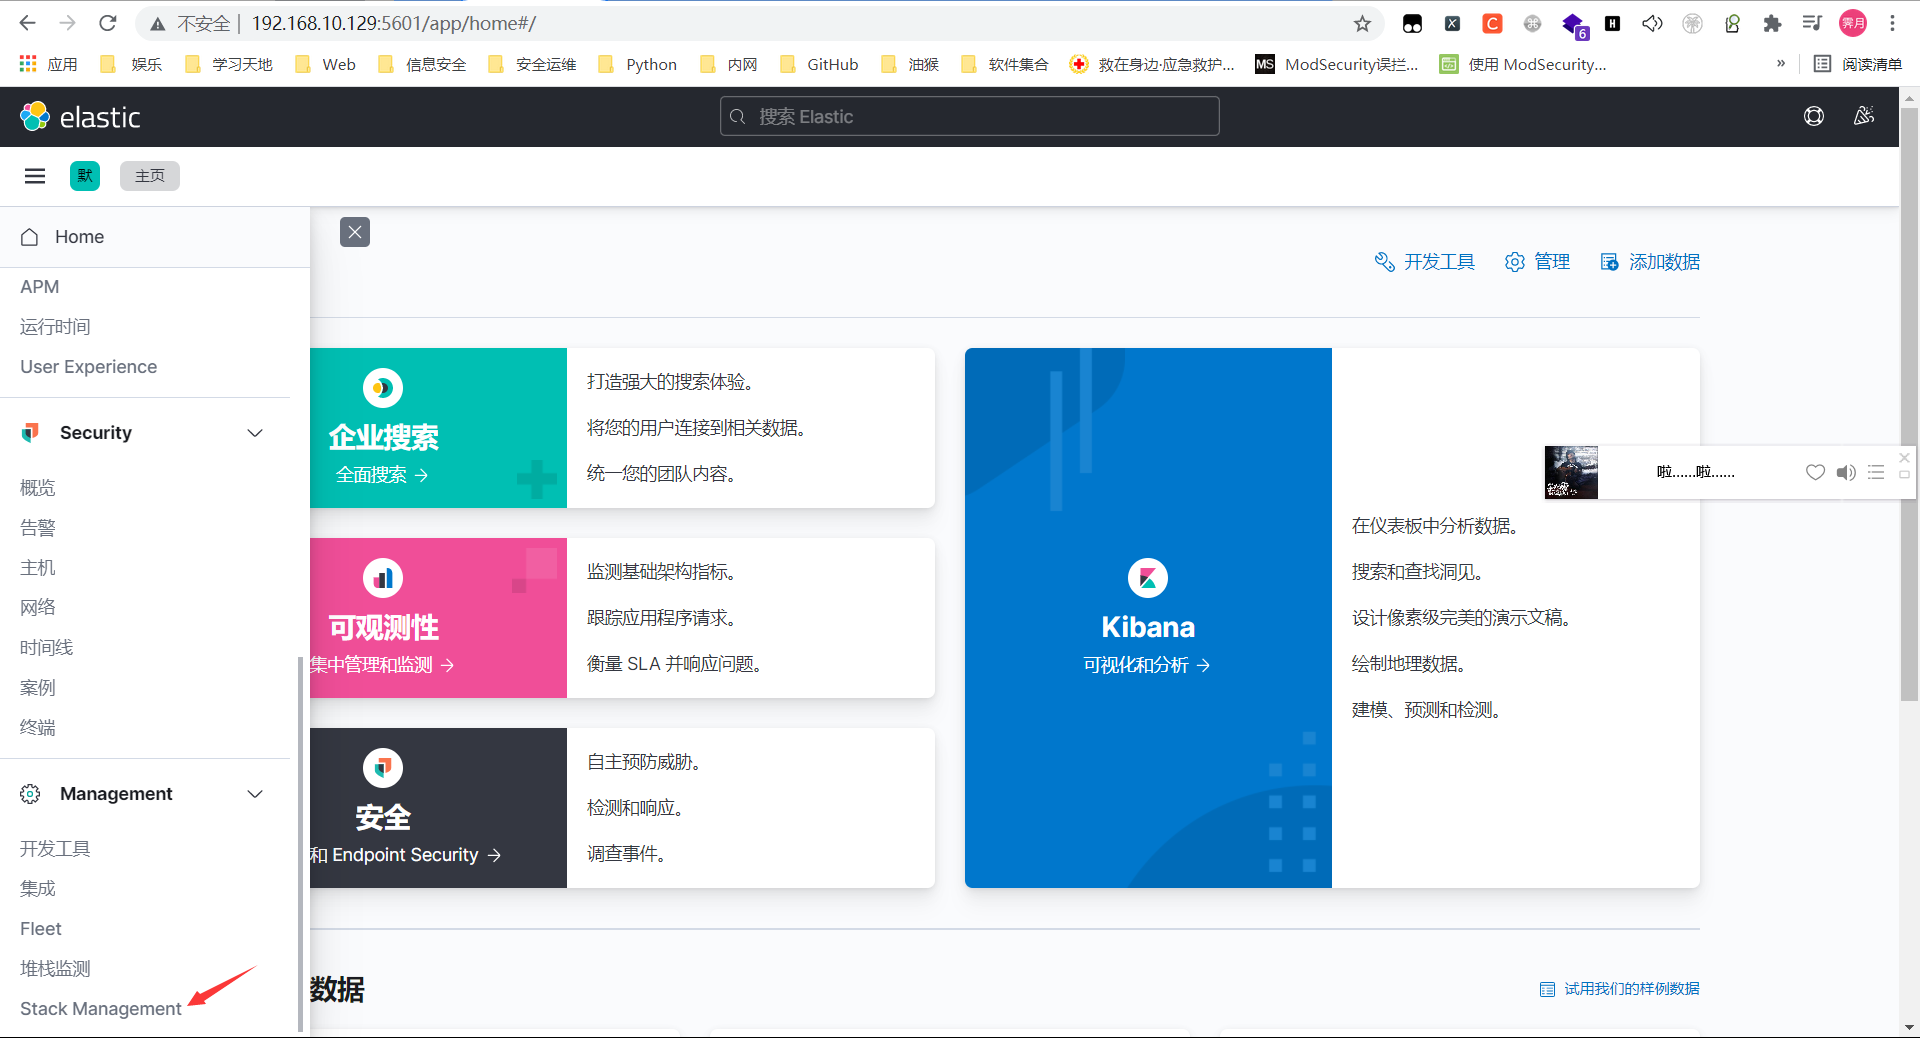
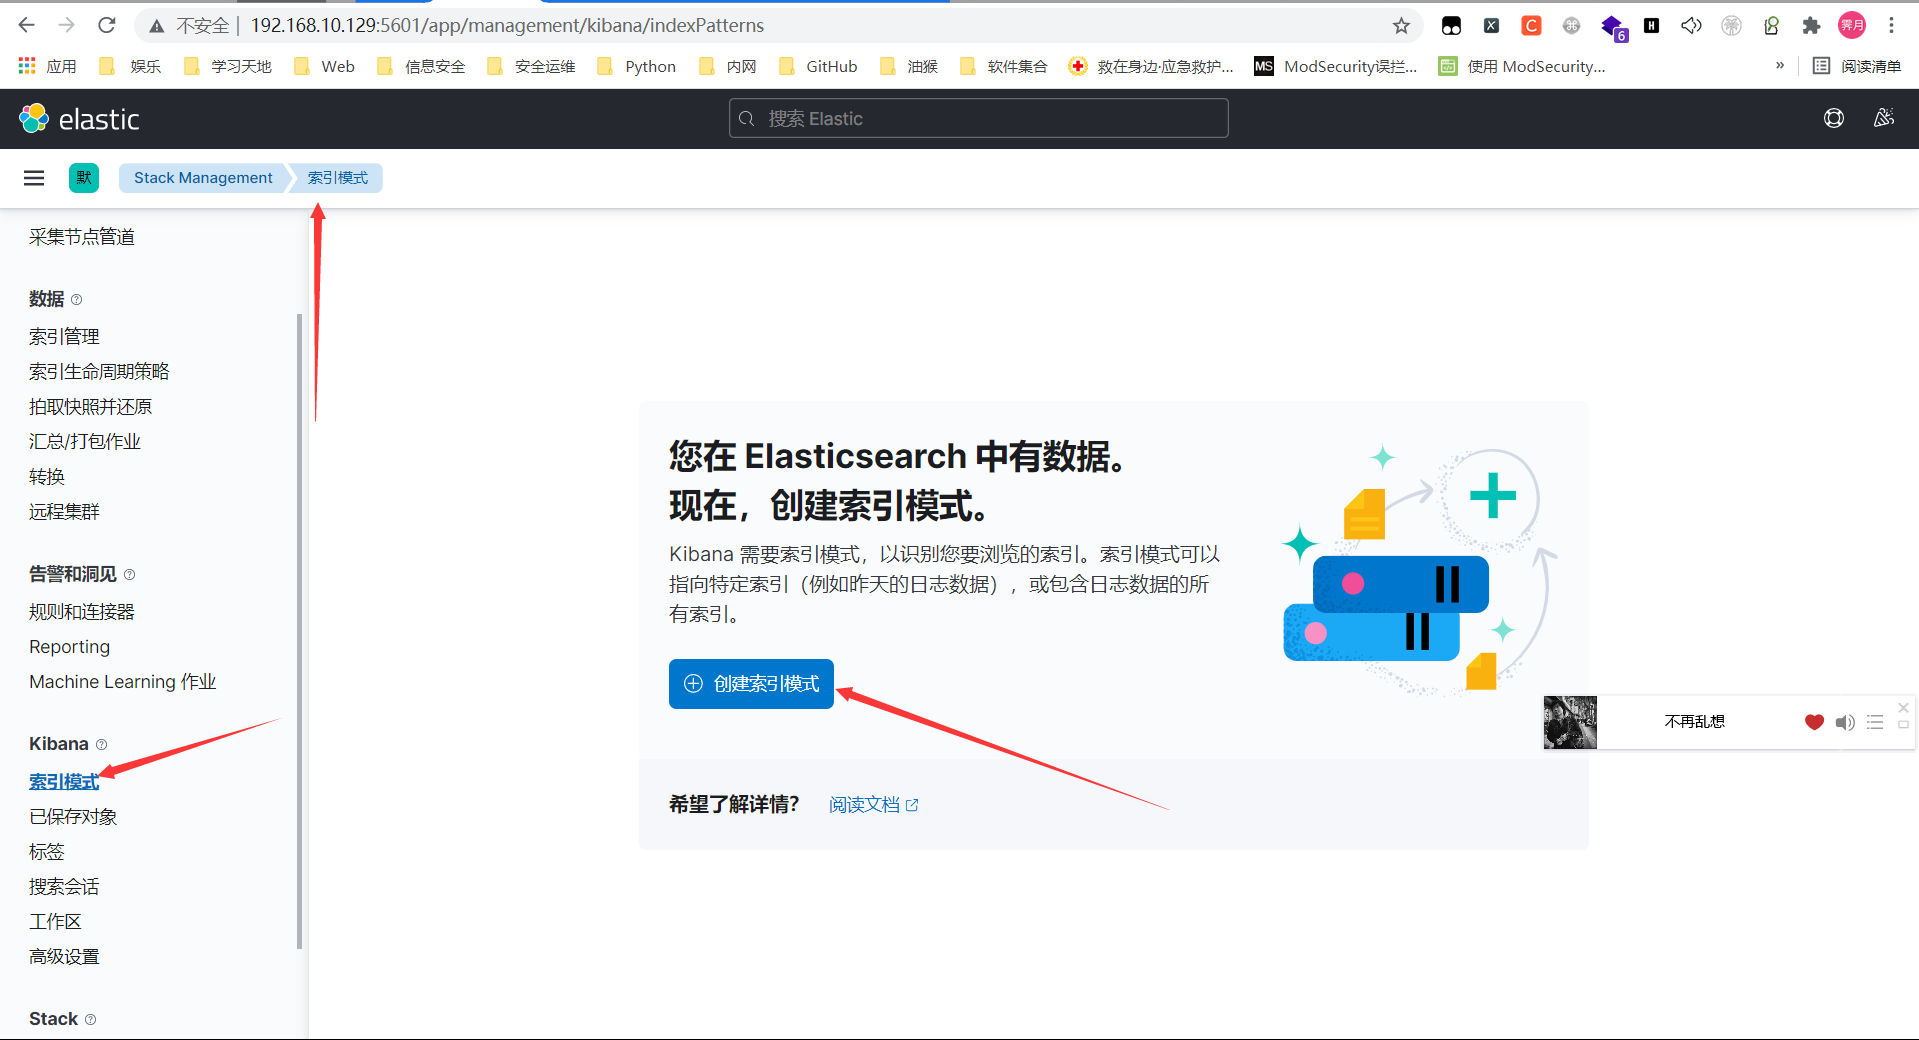
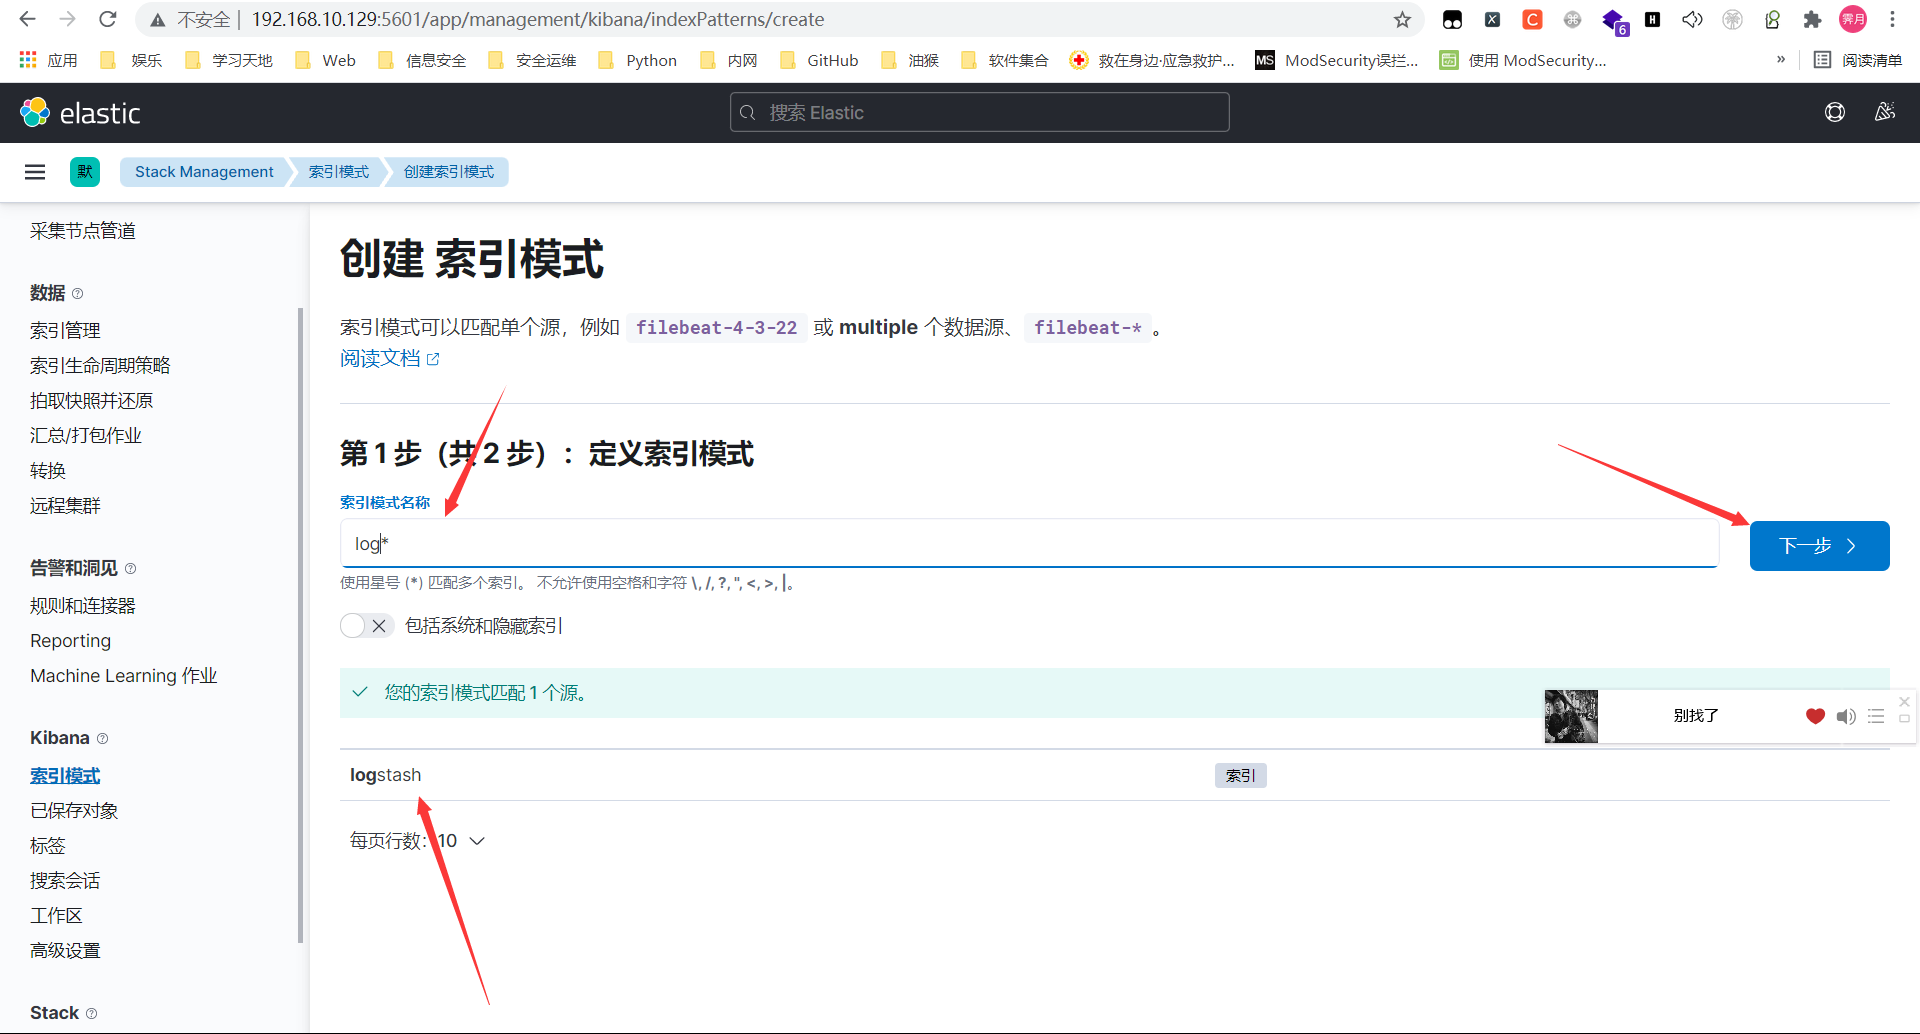
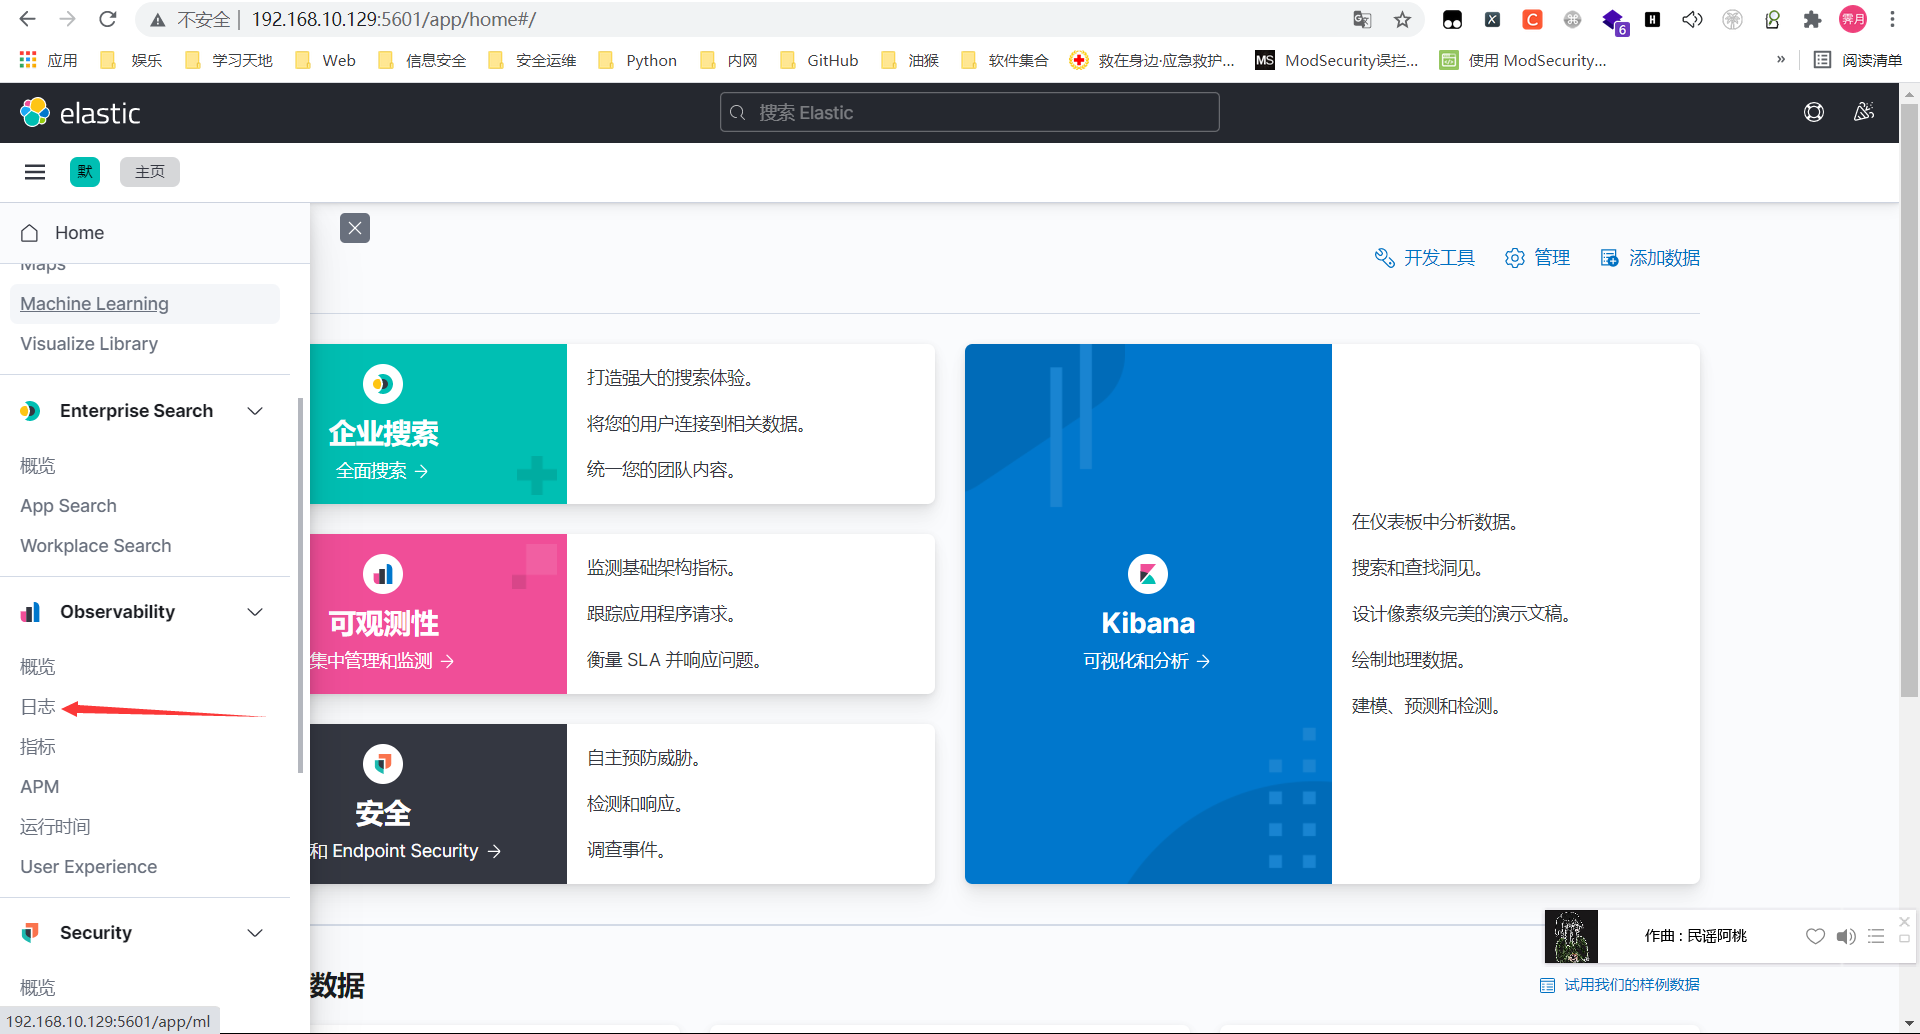
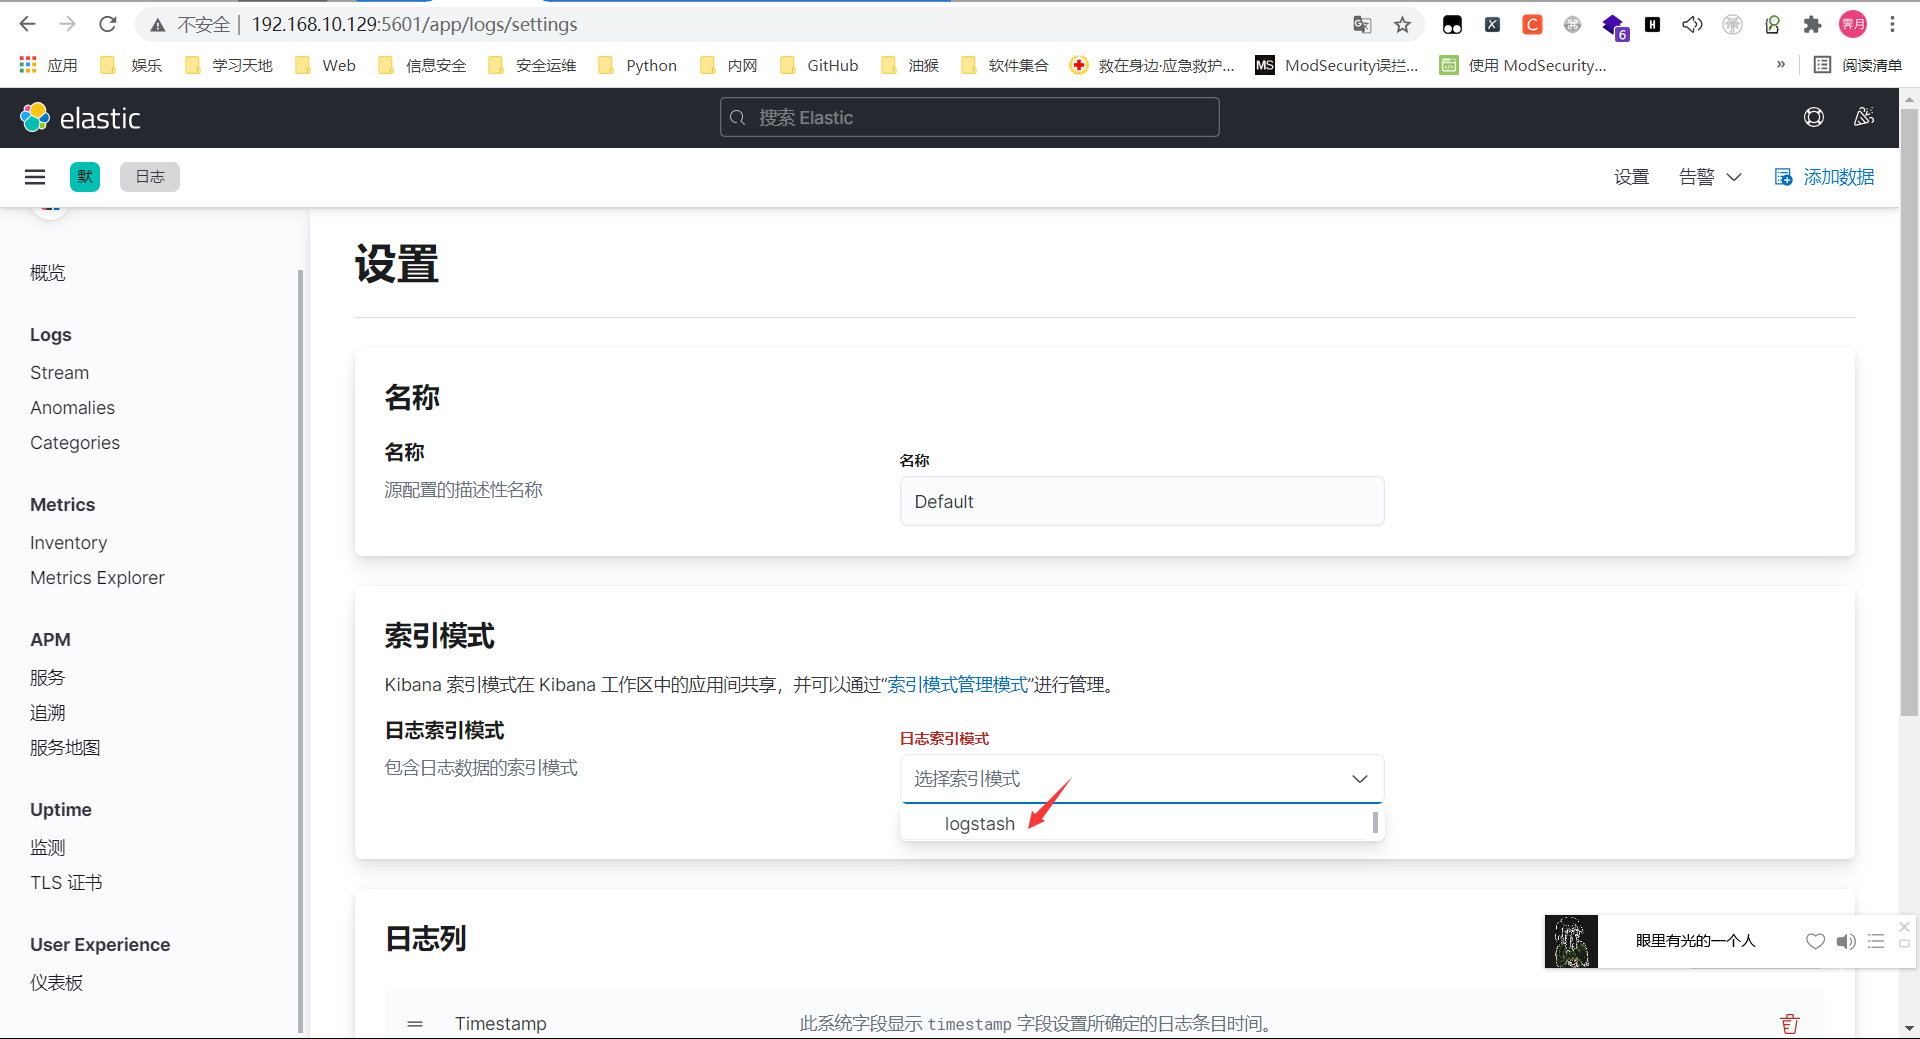
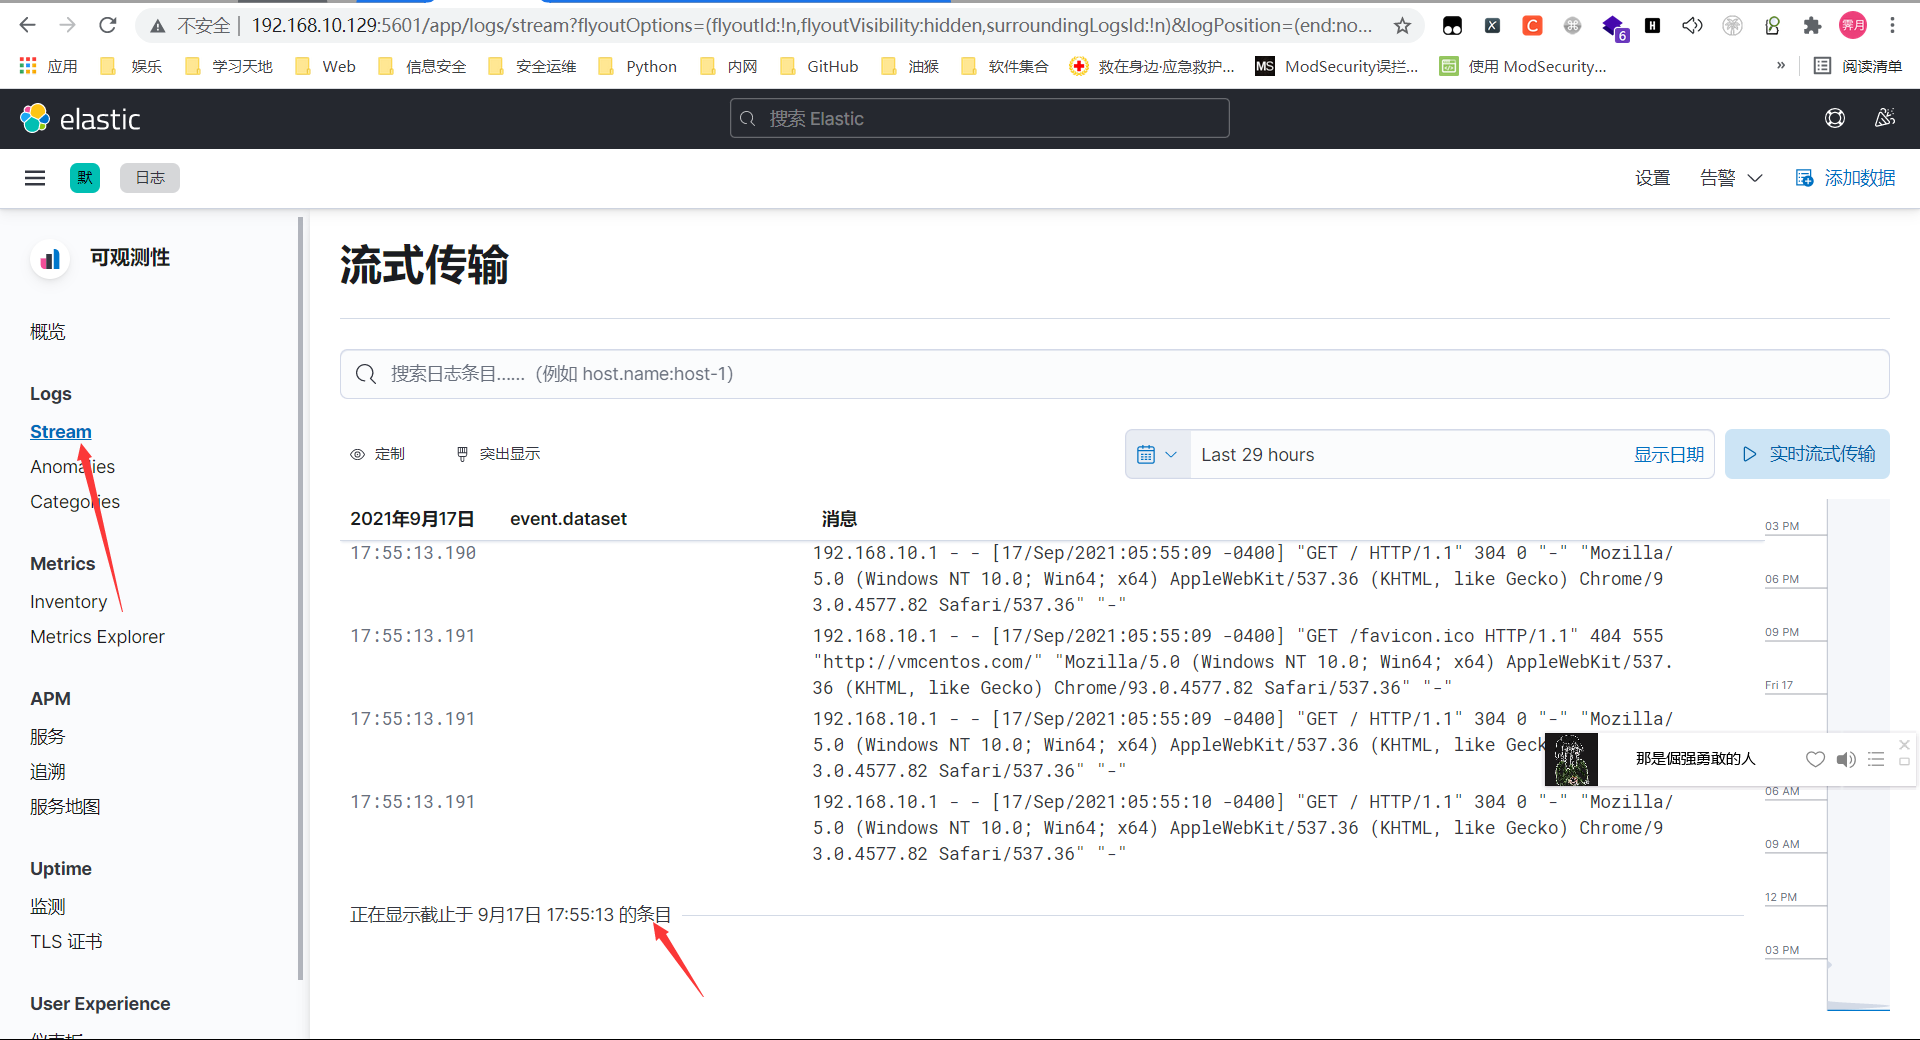
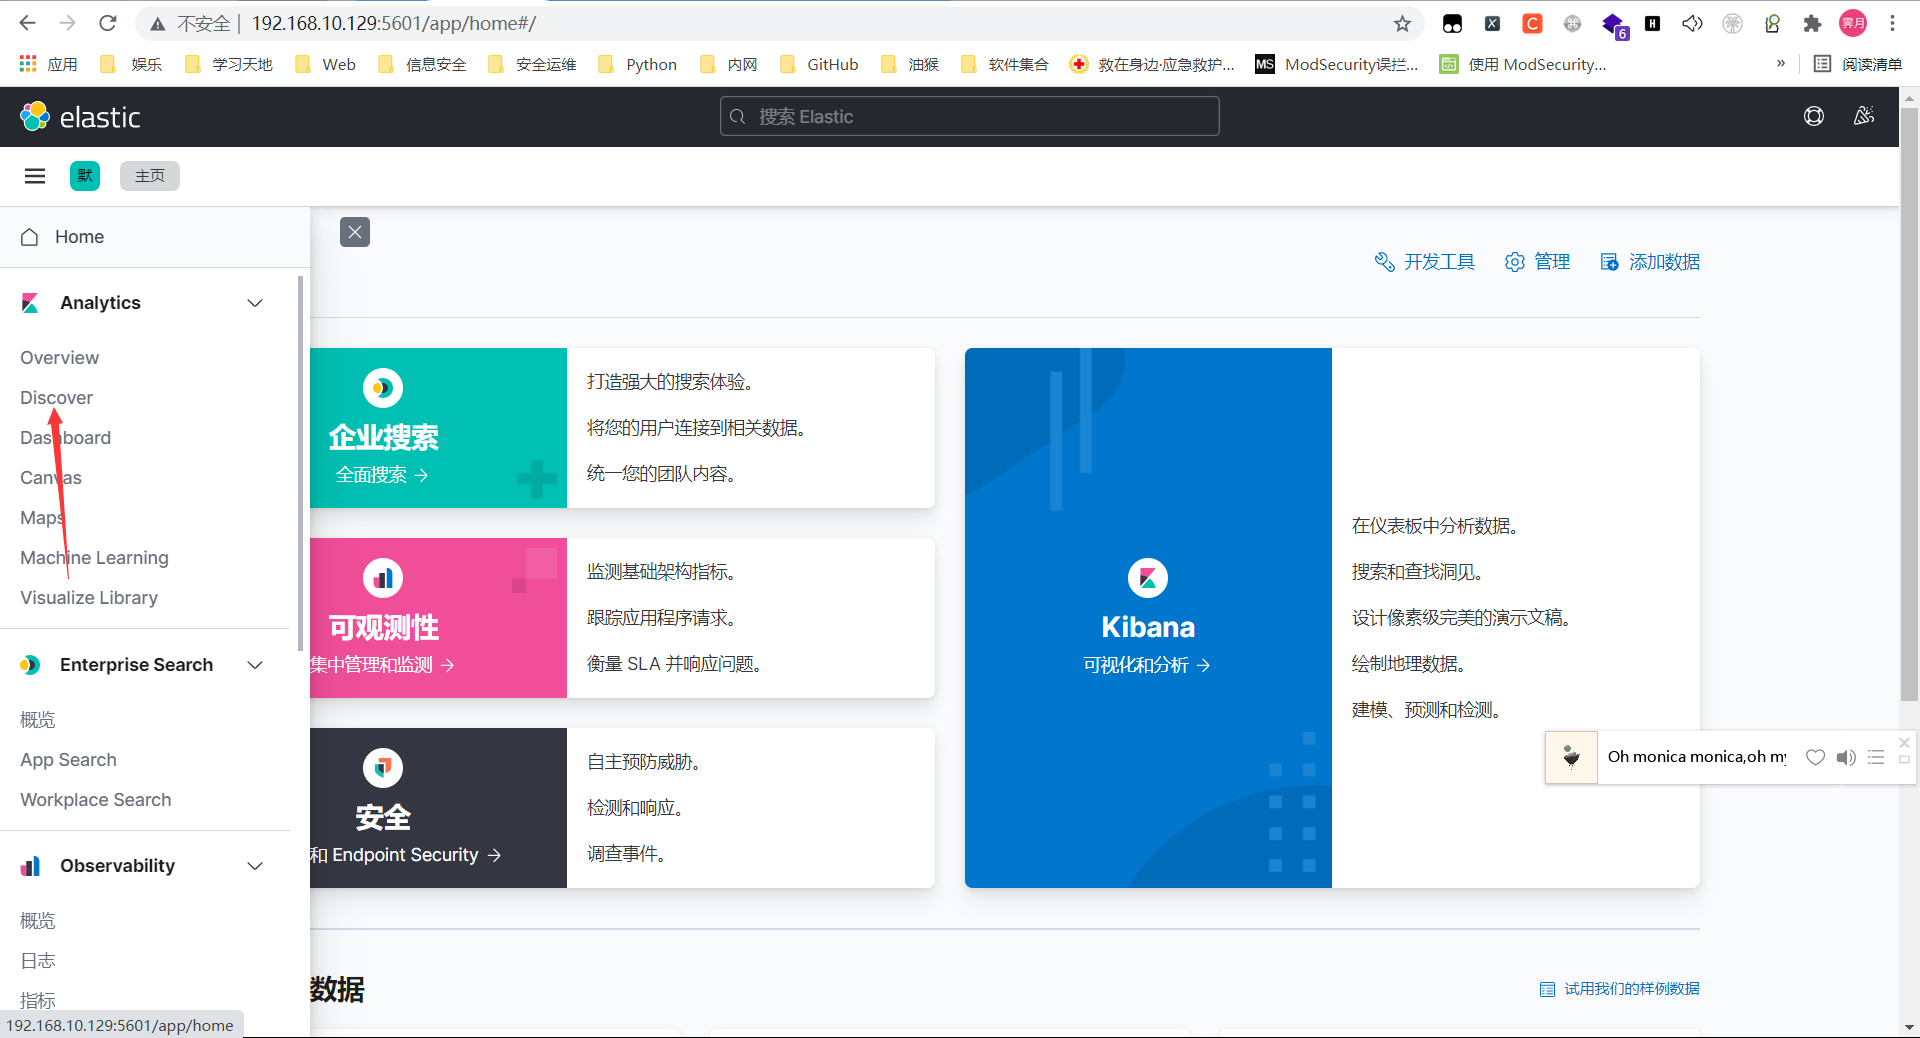
配置Kibana